

A Synopsis of the Research Report.

Overview
This research project focused on the design and implementation of a water quality collection apparatus capable of measuring pH and Total Dissolved Solids (TDS) in a freshwater body. The apparatus was developed using an Arduino UNO R3 microcontroller, an analog pH sensor, a Gravity Analog TDS sensor, a temperature and humidity sensor, a real-time clock module, an SD card storage system, and supporting hardware. The primary goal of the project was to create a relatively portable system capable of automatically collecting and recording water quality data (specifically pH, TDS, and temperature values) over a given period of time.

Methodology
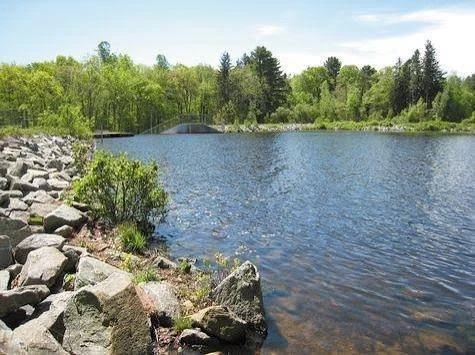
The apparatus was positioned approximately 1.5 feet from the shoreline, while the pH and TDS sensors extended approximately 1.5 to 2 feet horizontally into the pond. Small buoys were attached near the ends of the sensors to maintain their position and prevent them from hitting the pond bottom or loose sediment. Data collection occurred between 6:00 a.m. and 7:00 a.m. on July 24 and July 31.
The system was programmed in C++ using the Arduino Integrated Development Environment. Measurements were automatically recorded to an SD card, allowing the collected data to be transferred to a Microsoft Excel spreadsheet for analysis. The system recorded time, date, temperature, humidity, pH, and TDS measurements.
-
Before testing began, the research site was observed on July 21 and July 28 to document water level, water clarity, visible pollutants or contaminants, public activity, rainfall, and general water flow. Both observations followed periods of rainfall and thunderstorms. On July 21, approximately 1.1 inches of rain were recorded, while approximately 1.0 inch of rain was recorded on July 28.
-
Prior to testing, the TDS sensor was calibrated using a manually prepared 1,000-ppm solution consisting of one gram of table salt mixed into one liter of distilled water. The pH sensor was calibrated using 7.00 and 10.00 pH buffer solutions.
*More information, on this topic, is available in the “Calibration” section.

Conclusion
The study successfully demonstrated the development and use of an Arduino-based apparatus for automated water quality data collection. The measurements obtained from Messerschmidt Pond showed a combined average pH of 9.13 and a combined average TDS concentration of 27.83 ppm. The pH results varied between the two testing days, with the first test producing a higher average pH than the second. The TDS measurements remained relatively low on both days.
Based on the parameters examined in this study, the tested portion of Messerschmidt Pond exhibited TDS levels that were within the range discussed in the report (and as denoted by the US EPA) as appropriate for freshwater conditions. Moreover, given the rather low TDS values that were recorded, it was concluded that there is nowhere near a significant amount of runoff polluting the pond. Just for reference, the US EPA defined a freshwater TDS level of less than 1,000 ppm as being suitable for recreation and aquatic life. The pH measurements, however, were slightly elevated overall, with the combined average exceeding the stated upper pH value of 9.0 (this is what the US EPA defines as the max pH level for freshwater body that is safe for recreation and aquatic life). Since the study measured only pH and TDS, and because testing was limited to one location and two one-hour periods, the findings do not necessarily provide a complete assessment of the pond's overall safety for aquatic life or public recreation. Though the results prove to be promising, additional testing of other water quality parameters and sampling at multiple locations and times would be necessary to develop a more comprehensive assessment.
Evaluation and Limitations
-
Several potential sources of error were identified. The manually prepared TDS calibration solution could have introduced measurement error because of inaccuracies in weighing or transferring the sodium chloride. Similarly, the pH calibration process could have been affected by incomplete cleaning of the probe between buffer solutions, potentially resulting in cross-contamination and inaccurate calibration.
Sensor placement also presented a potential source of error. Although efforts were made to prevent sediment and vegetation from interfering with the sensors, these materials could have moved into the testing area during the one-hour collection periods. Additionally, testing was conducted at only one location within the 73-acre pond and during only two one-hour periods.
-
The results cannot necessarily be generalized to the entire pond or used to characterize its water quality under all environmental conditions.
The study evaluated potential improvements for future testing. These include conducting measurements during both morning and evening periods, extending the testing period to cover a full day, improving the accessibility of the SD card module, reorganizing the program's code, and measuring additional water quality indicators such as hardness and alkalinity. Collecting a larger and more geographically diverse dataset would also provide a stronger representation of the pond's overall water quality in terms of pH and TDS.
The Results & Raw Data
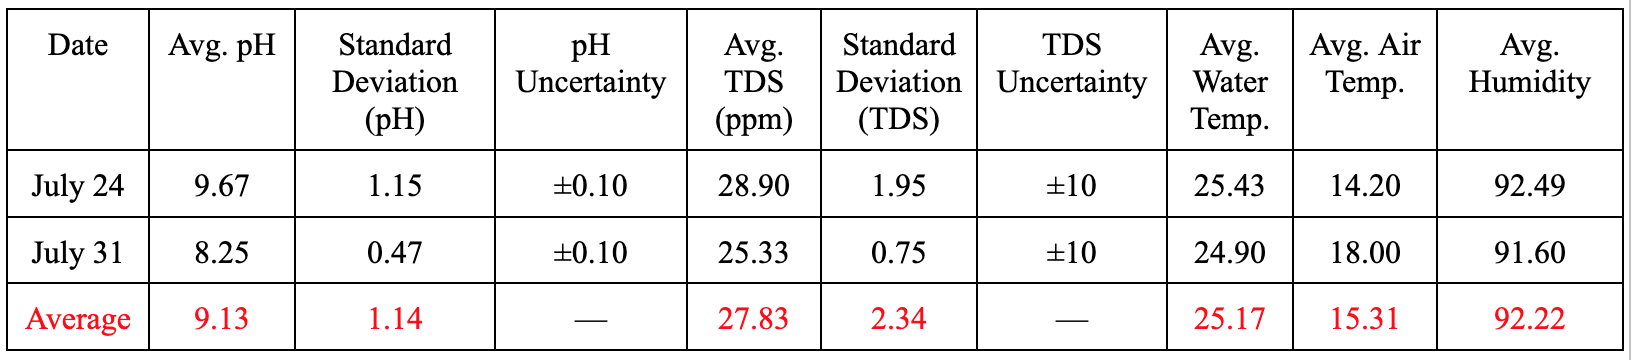
pH Standard Deviation
The data above highlights how the standard deviation for the average between the two test-days (July 24 and July 31) is 1.14. Given the pH scale (1-14), a standard deviation of 1.14 here is considerably high as a change in 1 pH can completely alter the classification of a water sample as “safe” or “unsafe.” All of the above will be touched on in the “Evaluation” section of the lab report.
TDS Standard Deviation
The standard deviation for the average between the two test-days (July 24 and July 31) is 2.34. Given the context of the TDS scale (0-1000), the standard deviation of the TDS values is considerably low.